Random Variables Using R
Scenario
During one of the many ups and downs of the COVID-19 pandemic, a provincial government in Canada introduced a regulation limiting the number of customers in stores to no more than 50% of the store’s maximum capacity.
To examine customer behavior and compliance with this restriction, a study was conducted to estimate the average customer volume, expressed as a percentage of store capacity, on a specific day.
Study Design
A random sample of 50 stores was selected. For each store, the percentage of its capacity occupied by customers on the selected day was recorded. These observations were then analyzed to determine the average customer volume across the sampled stores.
Random Variable and Data
The random variable is the percentage of a store’s capacity occupied by customers on a given day.
Before collecting the data, the random variable can take any value from 0% to 50%, since the government restriction limited store occupancy to a maximum of 50% of capacity.
After the study was conducted, the random variable took specific observed values for each of the 50 sampled stores. These observed values constitute the data collected for the study.
Sample Space and Categories
For easier analysis, stores can be grouped into five categories based on the percentage of their capacity occupied by customers:
- Category 1: More than 40% and up to 50%
- Category 2: More than 30% and up to 40%
- Category 3: More than 20% and up to 30%
- Category 4: More than 10% and up to 20%
- Category 5: 10% or less
These categories provide a simple way to organize the observations and examine the distribution of customer volume across the sampled stores.
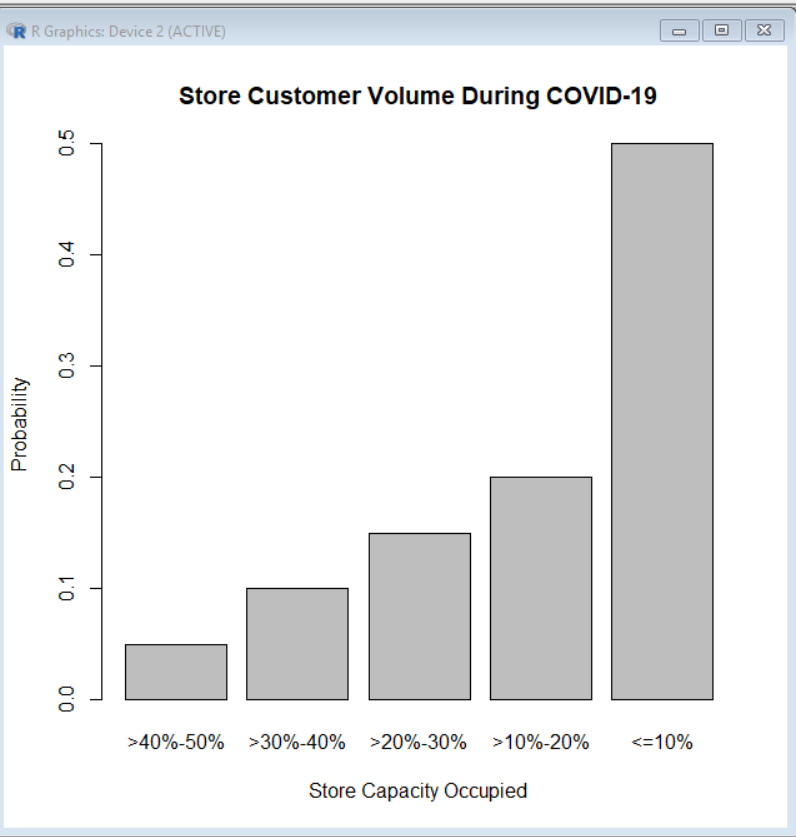
The sample space and assigned probabilities represent one possible distribution of customer occupancy that could be observed in the study. In this example, the probabilities are higher for the lower occupancy categories. This suggests that many stores had relatively few customers compared with their maximum capacity.
One possible explanation is that customers were more cautious because of COVID-19 health and safety concerns. Some customers may also have preferred online shopping to reduce their potential exposure to the virus. These factors could have contributed to fewer in-store visits and lower customer occupancy levels.
Overall, the random variable and its probability distribution provide a useful way to analyze customer behavior and estimate the average level of store occupancy during the pandemic.
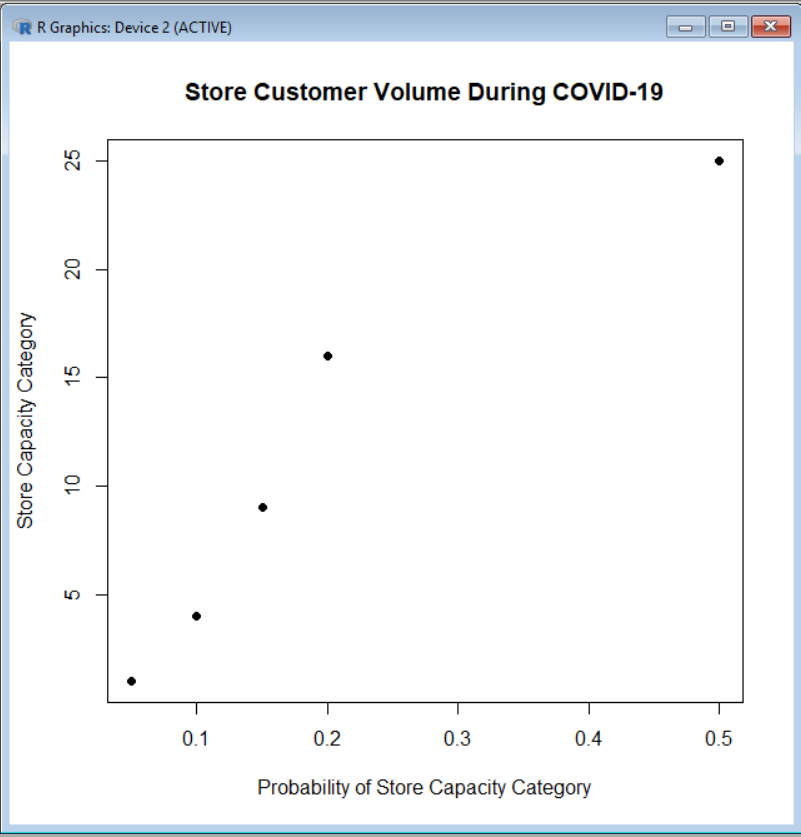
x <- c(0.05, 0.10, 0.15, 0.20, 0.50)
y <- c(1, 4, 9, 16, 25) plot(x, y,
- main = “Store Customer Volume During COVID-19”,
- xlab = “Probability of Store Capacity Category”,
- ylab = “Store Capacity Category”,
- pch = 19)
category <- c(“>40%-50%”, “>30%-40%”, “>20%-30%”, “>10%-20%”, “<=10%”)
probability <- c(0.05, 0.10, 0.15, 0.20, 0.50)
barplot(probability, main = “Store Customer Volume During COVID-19”, xlab = “Store Capacity Occupied”, ylab = “Probability”, names.arg = category)
data <- c(10, 40, -18, 24, 19, 0, 32)
p <- c(.13, .17, .05, .10, .24, .16, .15) mean <- sum(data * p) mean [1] 18.96